


Role
UX Researcher
UI/UX Designer
Team
Individual research & design
Project type
Academic Project
Statistical Dashboard Application
Timeline
12 Weeks
Research → Design → Test → Iterate

MOBILE & WEBSITE APPLICATION
(MOBILE-FOCUSED)
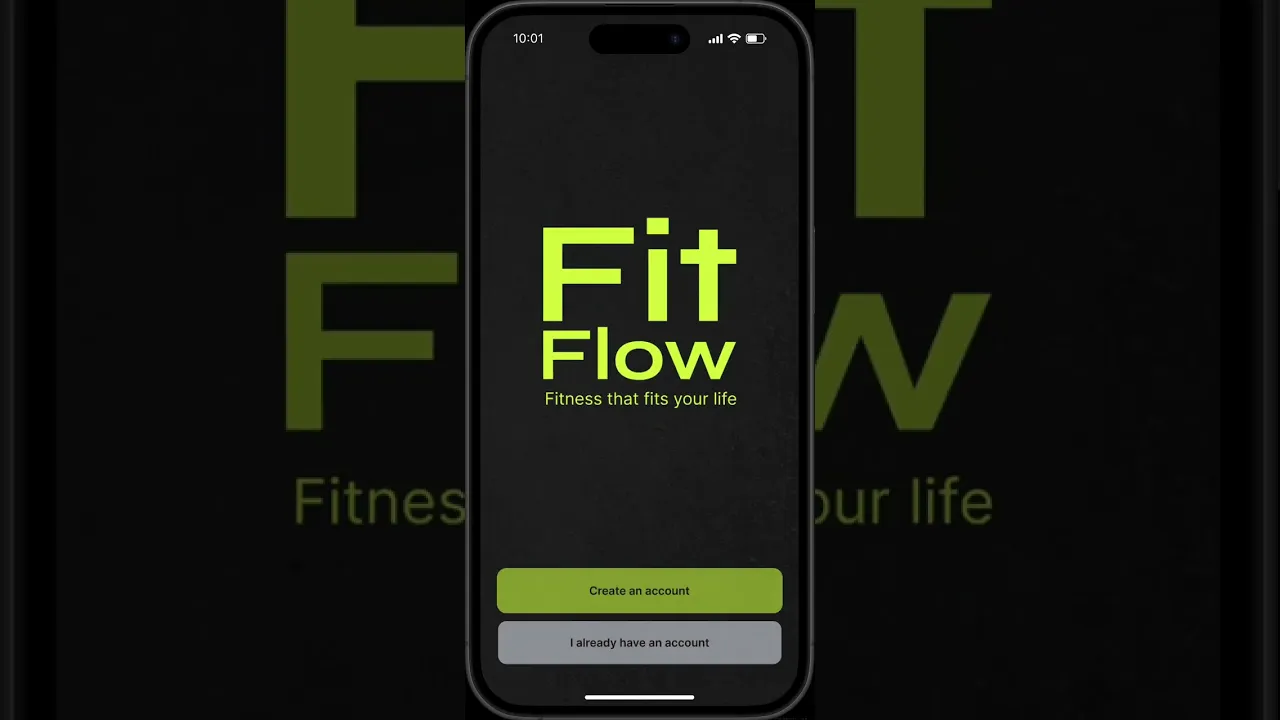
FitFlow
Fitness that fits your life
FitFlow helps busy people find workouts, track their activity and understand their progress in one place. I started by doing research, then using my co-design session and interview insights to design an interface that explores how a fitness app could help users find suitable workouts and stay in control of how they exercise.
The Context
Interviewees felt that making time for exercise wasn’t always straightforward due to life circumstances and access to equipment. Furthermore, Finding workouts and tracking progress also meant that users have to switch between different apps and platforms.
FitFlow explores how these activities could come together in one experience. Designed for busy adults aged 20–35, the idea is to combine easy-to-understand health and fitness data with workout suggestions that are shaped around users’ available time, preferences and circumstances.
How might we…
How might we help busy adults turn their fitness data and everyday constraints into achievable workout choices, while keeping progress clear and users in control?
Research
I began by reviewing three academic articles and conducting three competitive analyses, which helped me explore different approaches regarding data visualisation, exercise logging and workout guidance.
I also conducted four semi-structured interviews with potential users to understand their habits, frustrations and expectations of the app.
To analyse the findings, I coded the transcripts and reviewed the sketches to identify recurring needs, which guided the app’s information architecture and core features.
Key Insights
Insight 1
Making Fitness
More Achievable
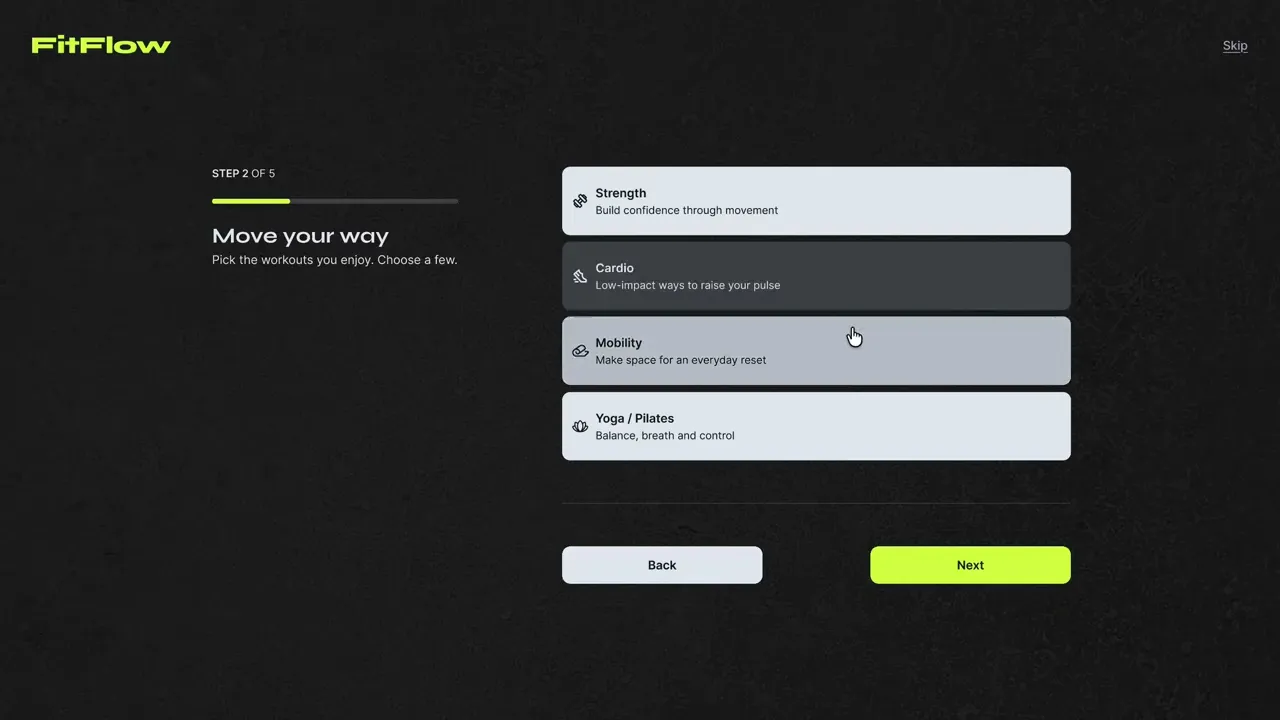
Participants needed realistic options that could accommodate their time, energy and equipment.
Design implication
The onboarding should capture these preferences to personalise the selection of workout suggestions to users.
Insight 2
Clarity Comes
Before Complexity
Participants wanted to see quick summaries with clear explanations and the option to explore further when needed.
Design implication
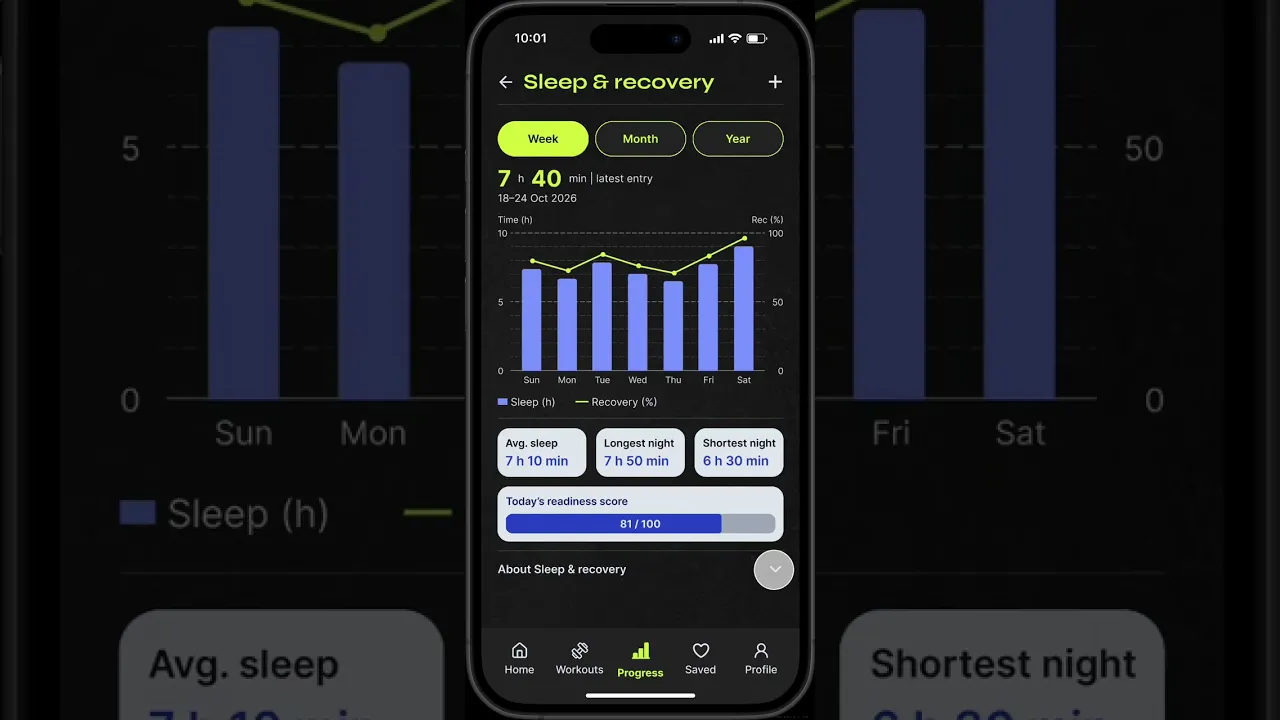
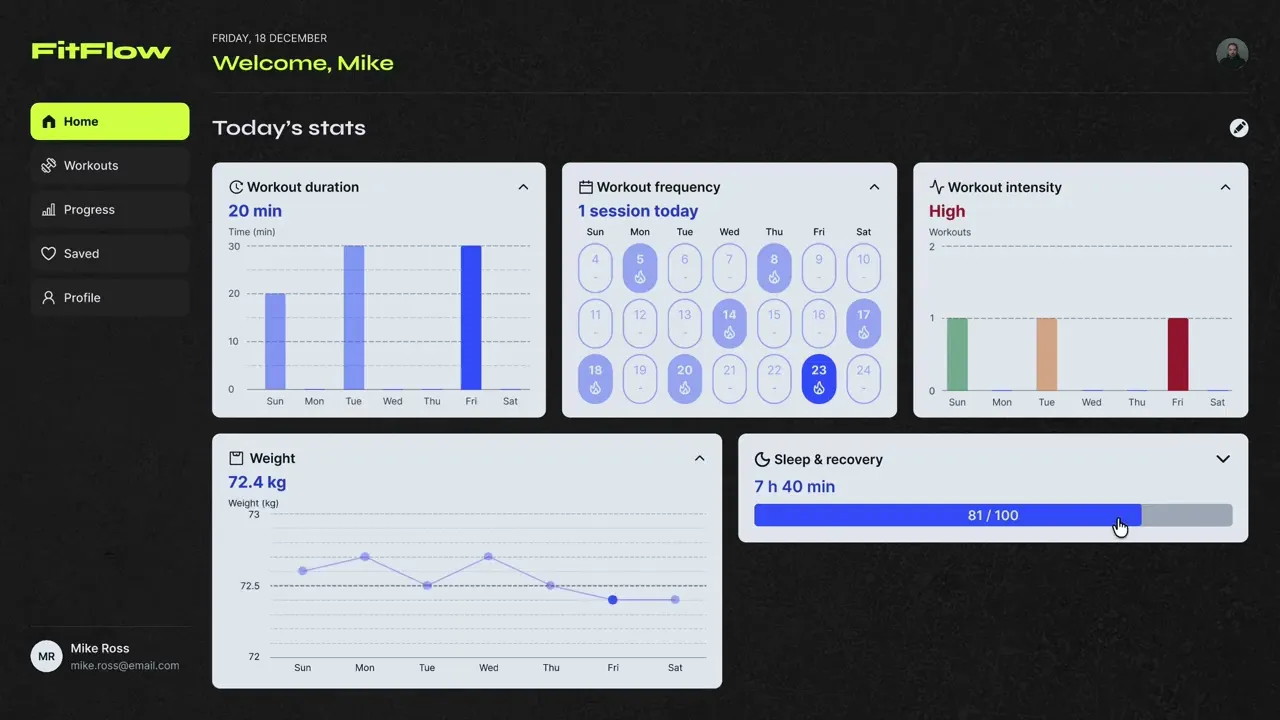
Prioritise core metrics on the dashboard with expandable cards and supporting text available on demand.
Insight 3
People Want Different Levels Of Guidance
Participants had different views: guided videos vs. independent workouts, they also want customisation options.
Design implication
Explain workout suggestions and workout modes, while giving users the ability to save and create their own workouts.
UX Mapping
The co-design sessions helped me understand what features participants wanted how they work. I mapped their proposed journeys to identify common insights across participants.
I translated my findings into FitFlow’s information architecture, tracing how participant insights and secondary research informed the app’s supporting features.
Design Decisions
Decision 1
A Simple Overview
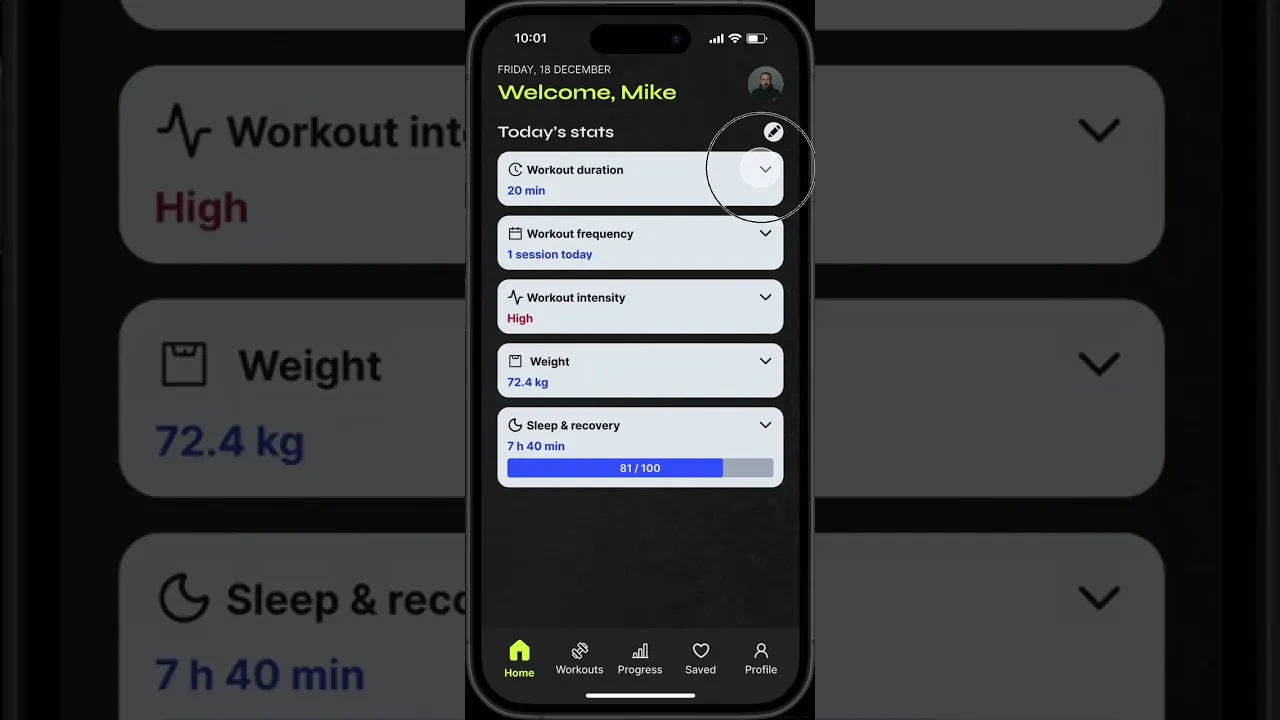
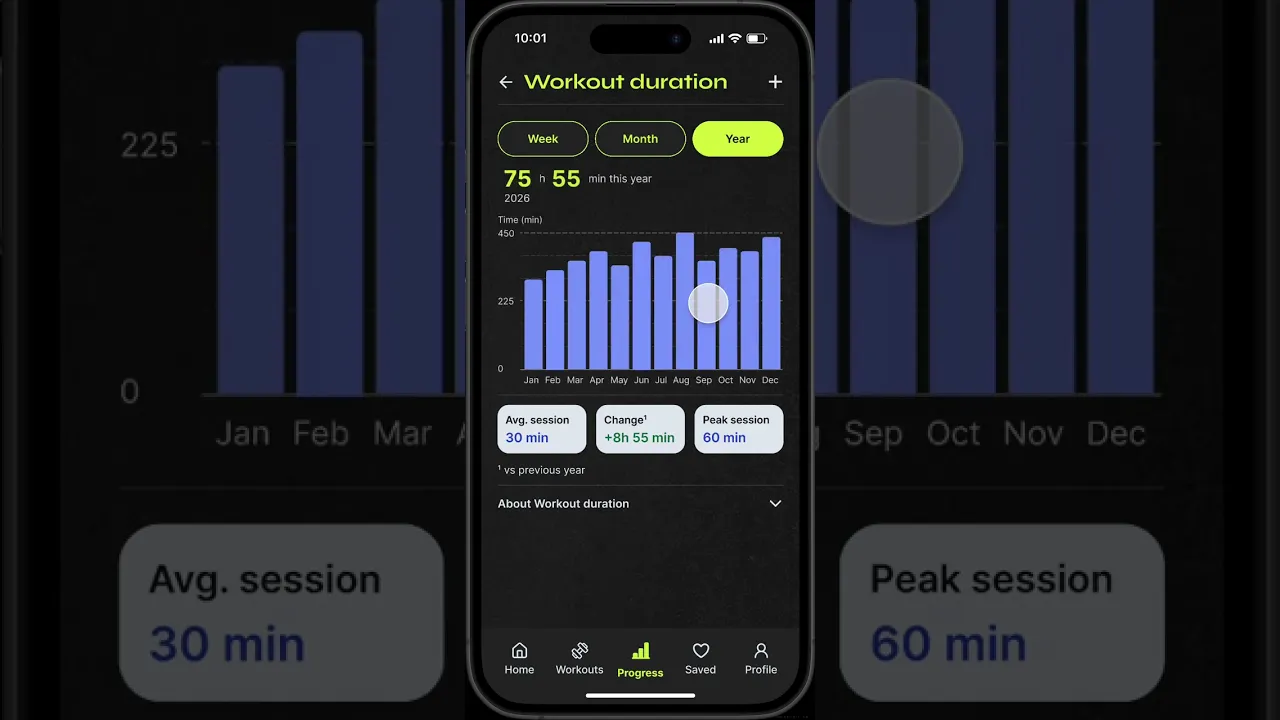
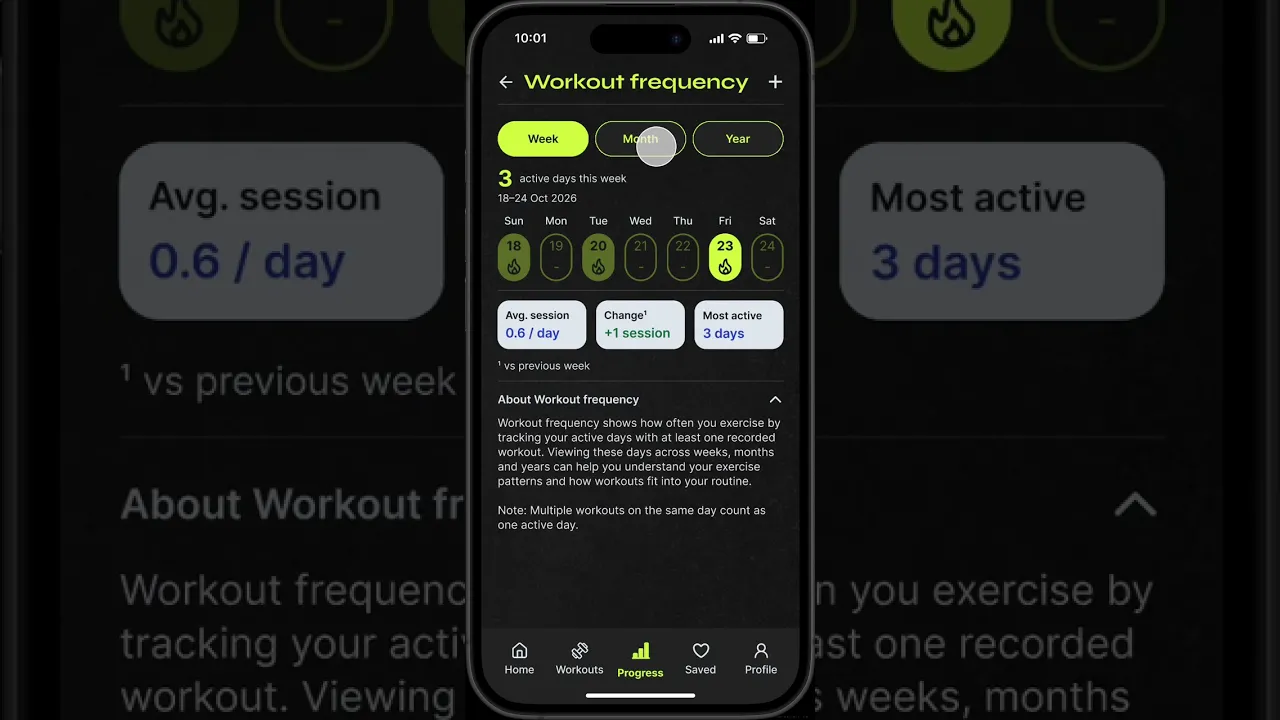
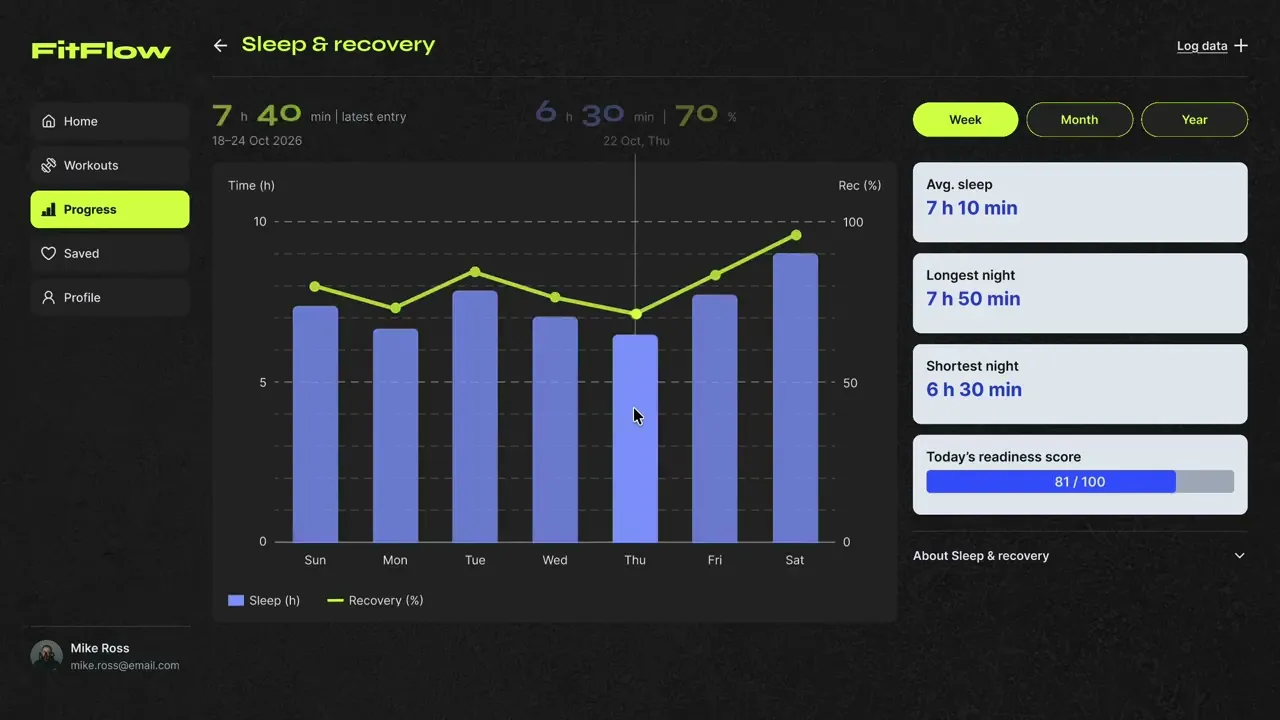
The dashboard focuses on summarised metric cards.
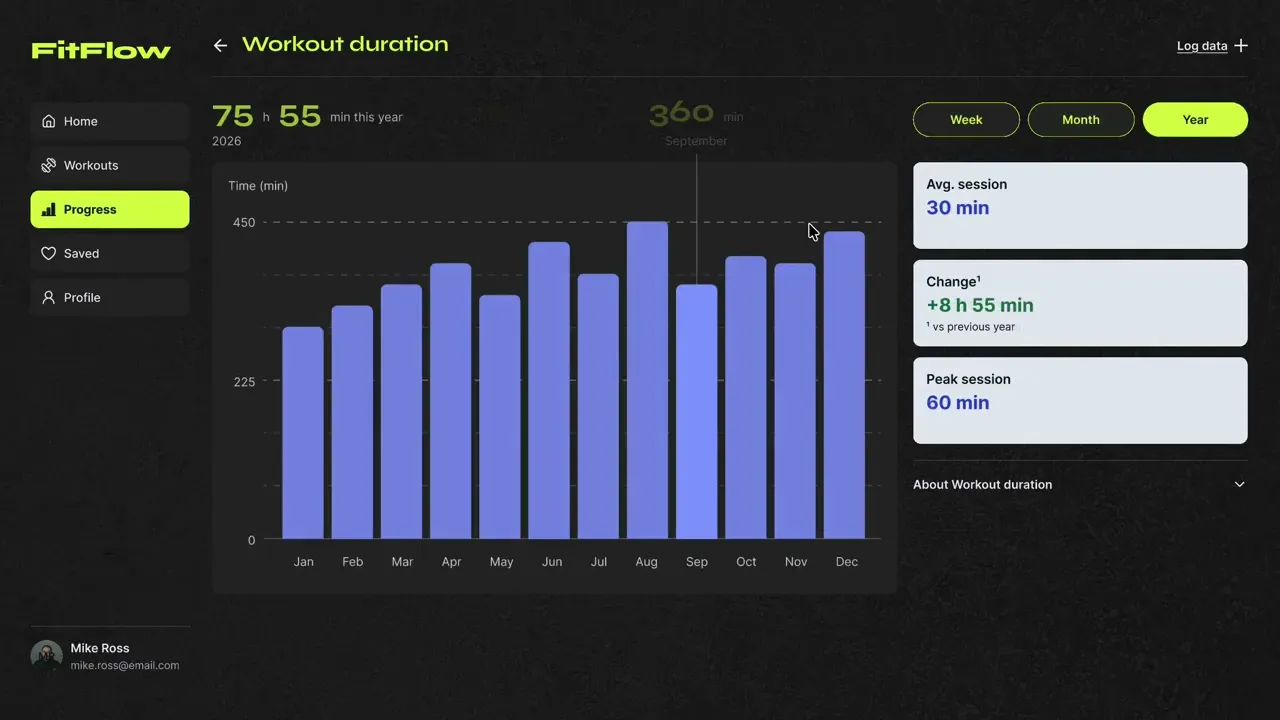
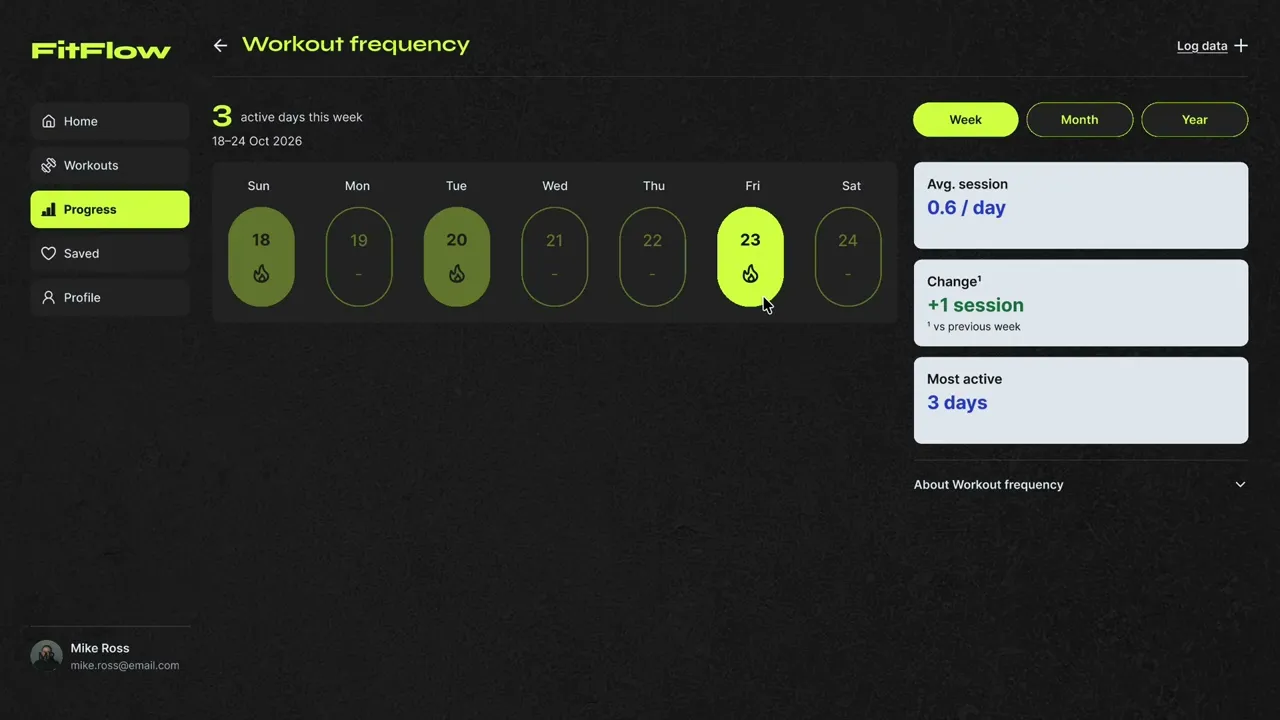
For more insights, they can expand the card or go to the detailed metric screens.


Decision 2
Explanations & Options
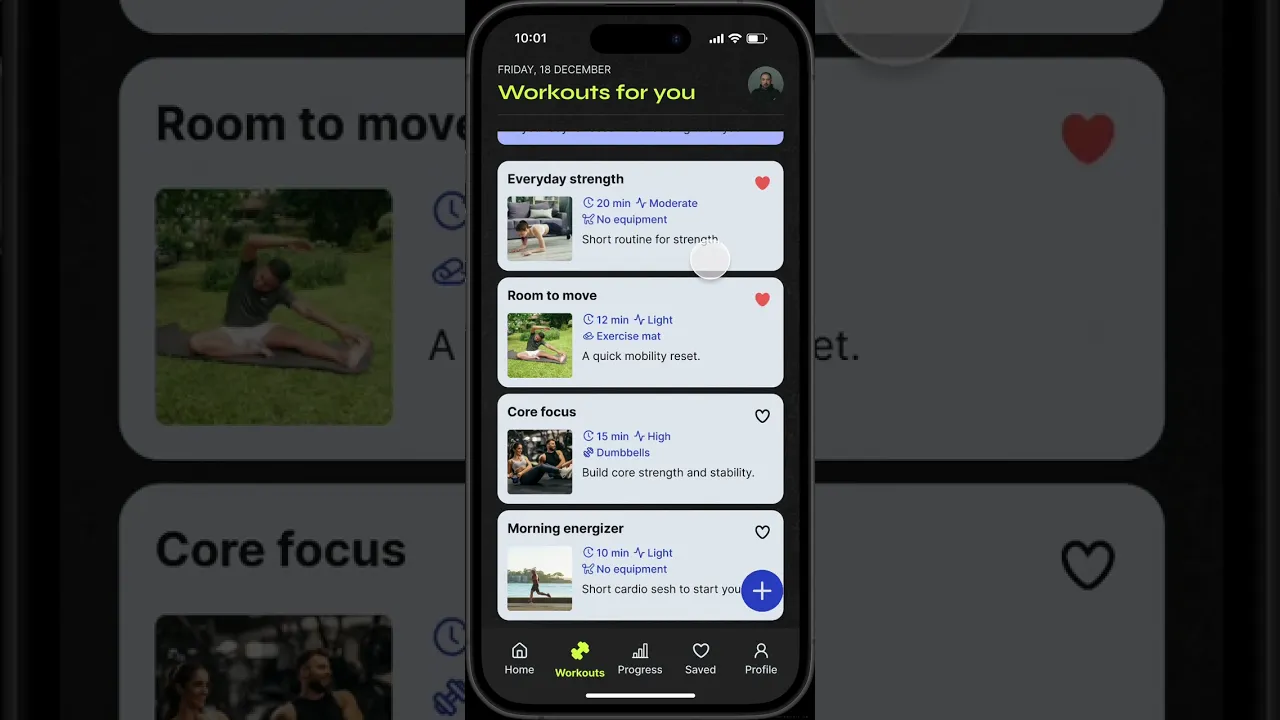
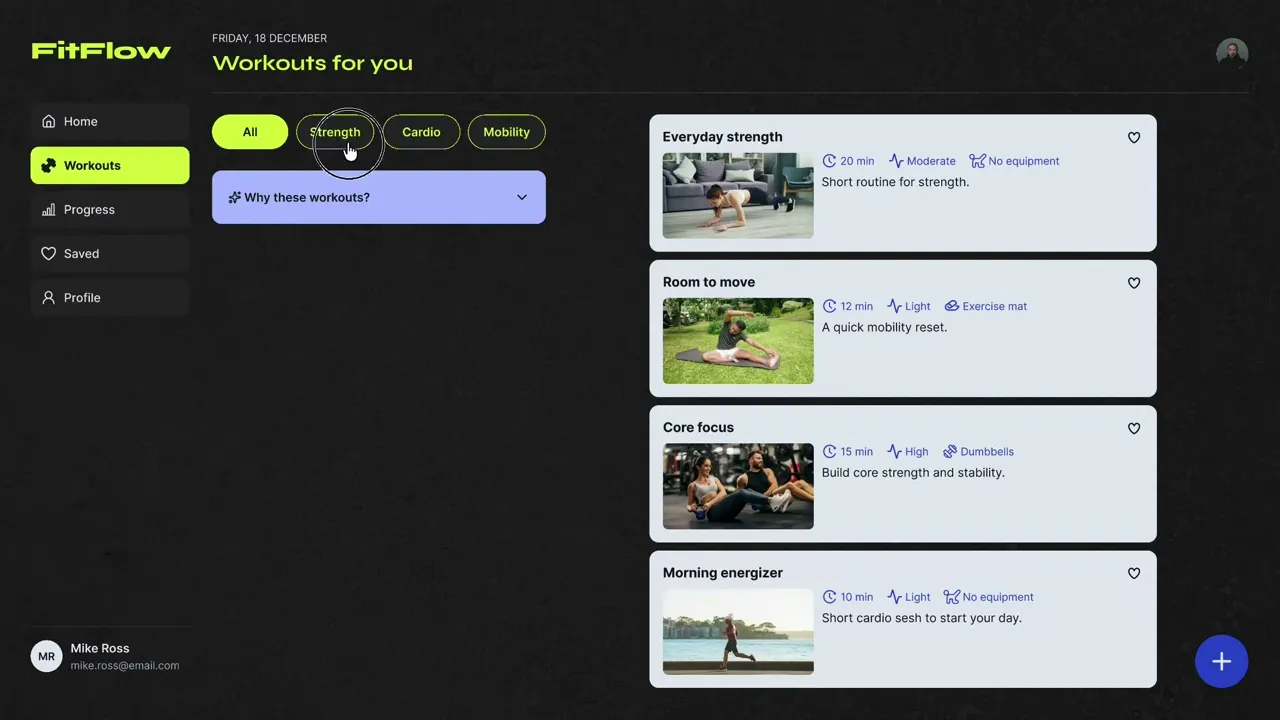
Workout cards highlight key details, while “Why these workouts?” explains the recommendations. Users can toggle modes and save or customise workouts.


Decision 3
Adapt The Layout
I designed with a mobile-first approach to establish the hierarchy, then adapted it for desktop. Everything else is kept consistent, except for interactions (tap → hover).


Design System
I used charcoal textures, electric-lime accents and royal-blue data highlights establish an energetic fitness identity.
For the app fonts, I selected Syne for FitFlow's brand character, while Inter supports legibility in the body copy and interface labels.
I also created mobile and desktop specific components, spacing rules and interaction states to maintain consistency throughout FitFlow.
Testing Insights
I conducted time-to-task tests with 3 participants, where they did 4 tasks on my prototypes. I recorded their times and observed for any difficulties along the way.
Desktop times were generally shorter, but participants had already done the mobile tasks. With only three participants and a simulated prototype, I treated the results as a way to identify issues rather than proof that one platform performed better.
Prototype Iterations
Iteration 1
Clarify Simulated Inputs
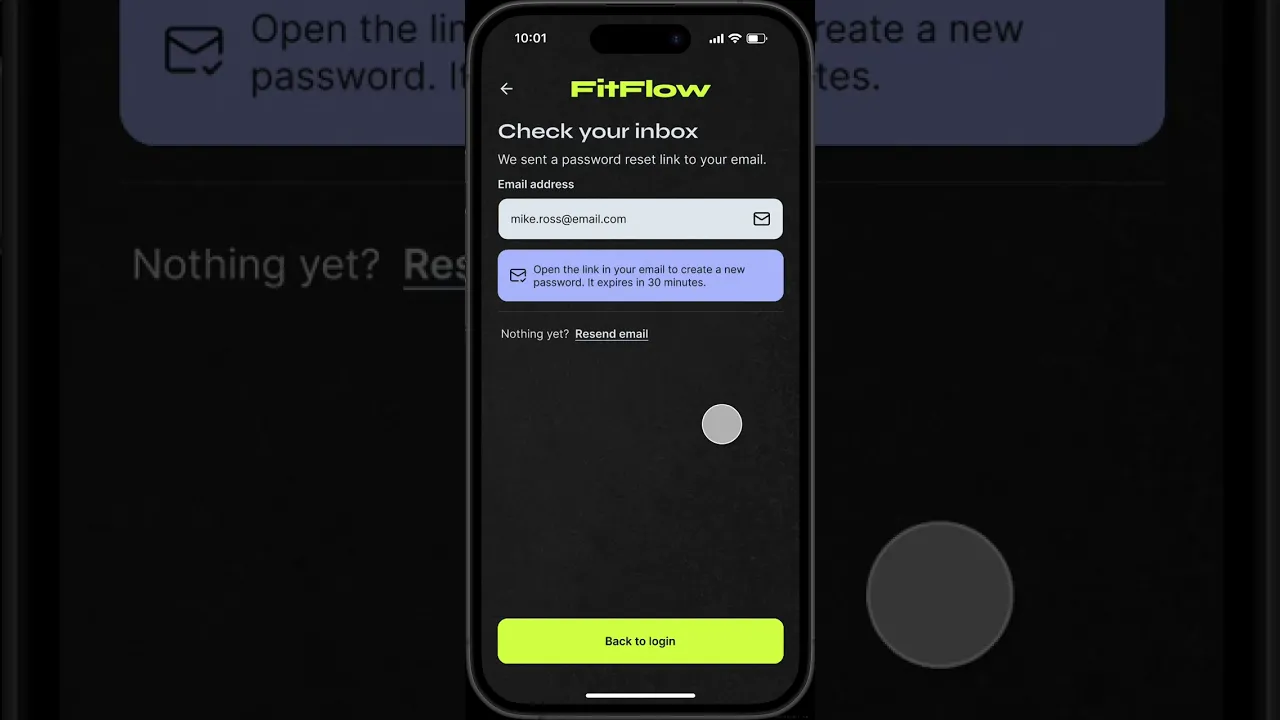
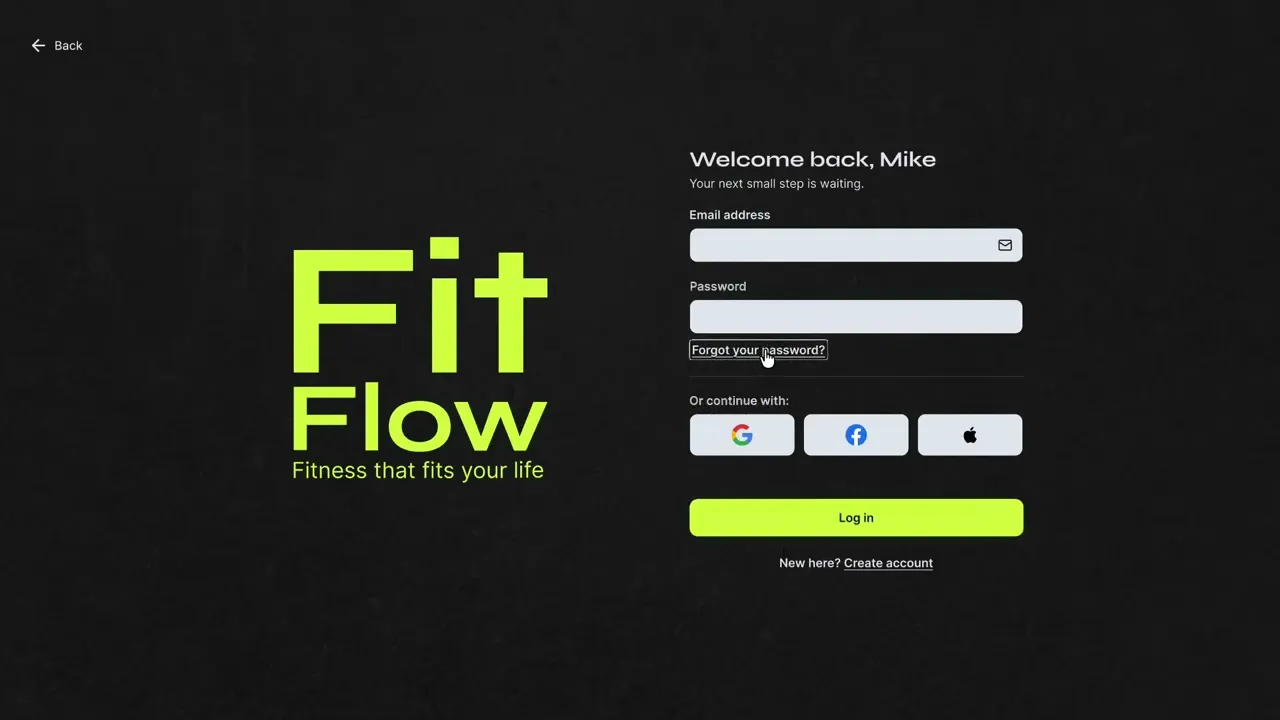
When testing, two participants tried to enter their personal details into the registration fields, they cited being confused by the simulated tap.
I added clearer input confirmation and disabled the button so it would be easier for users to identify the field states.


Iteration 2
Make Trend
Directions Clearer
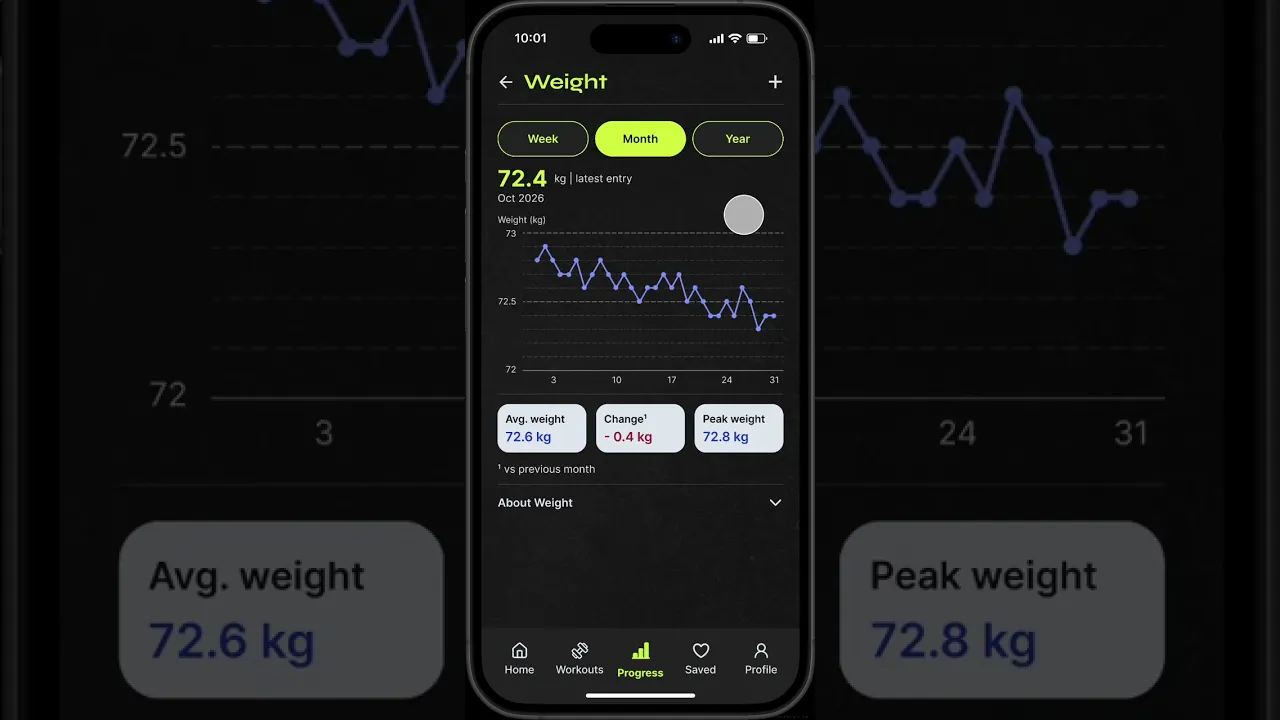
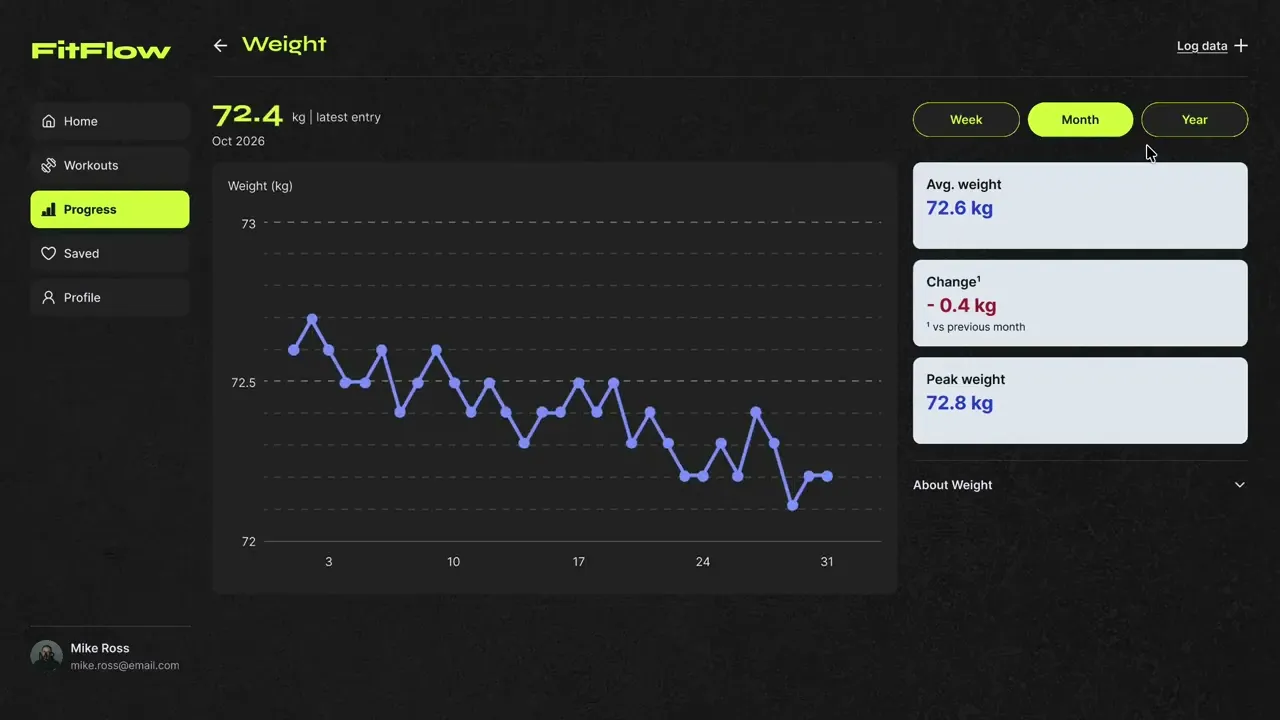
One participant initially gave the wrong response when describing the weight trend.
I added a directional arrow to the change card to make the movement easier to recognise alongside the number.


Iteration 3
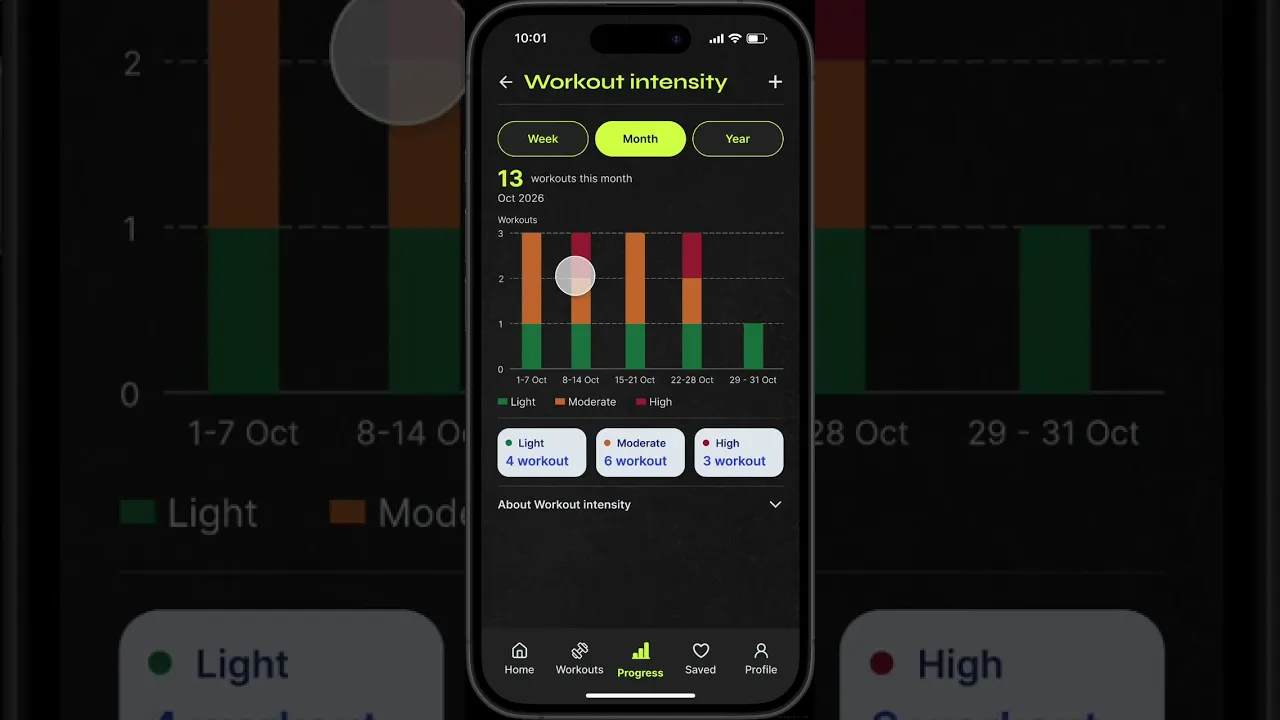
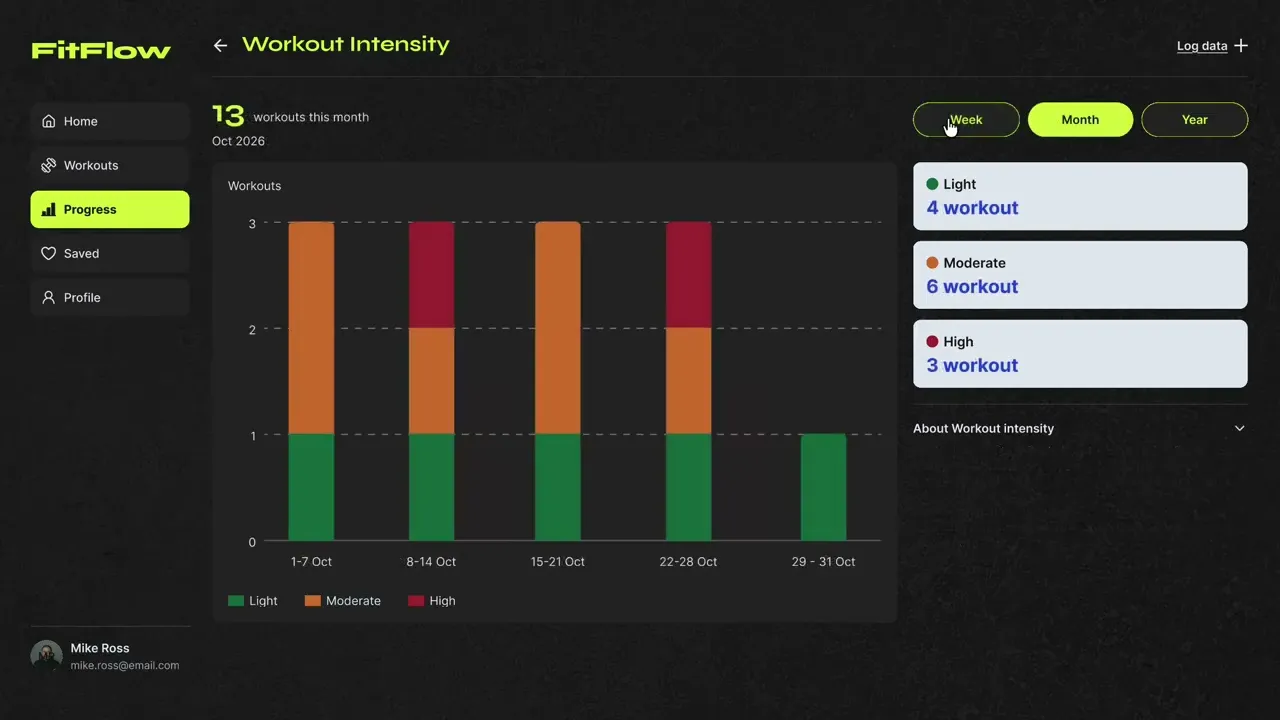
Strengthen Non-Colour Intensity Cues
A participant with red-green colour blindness managed to interpret the intensity chart using the shades and labelled legend.
I did not want to treat this single successful attempt as proof of accessibility, so I added patterns to the bars to strengthen the non-colour distinction between categories.


The Outcome
FitFlow started as a fitness dashboard idea, focusing on the ease of health & data metrics and logging workouts all in one platform.
Through my research, testing, and iterations, I was able to develop a prototype that showcased how FitFlow could support busy users in their fitness lifestyle.
Reflection & Next Steps
This project reminded me that users can have similar goals but prefer different features and experiences. Some participants wanted detailed tracking, while others preferred a quick summary or a video to follow. The challenge was balancing these requests with what I could realistically deliver within the project timeline.
Moving forward, I would test my revised prototype with a broader group of target users, including participants with colour vision deficiency to evauluate whether the updated colours and visual cues make the charts easier to interpret.
View Other Projects

MOBILE & DESKTOP APPLICATION
Compiled
Compiled is a multi-artist music merchandise platform that brings artists, collections and exclusive drops together in one place, making browsing and purchasing merch easier and more accessible.

MOBILE APPLICATION
Dive Deep
Dive Deep is a location-based mobile app concept that transforms Melbourne Museum into an interactive deep-sea expedition, inviting visitors to uncover stories through artefact-led discovery.

MOBILE APPLICATION
Better Binding: Buddi
Buddi is a scrapbook‑style wellbeing app designed to help transgender and gender-diverse youths safely track their binding journey and body comfort through gentle and personalised check‑ins.

Shannon
Liaw
shannonliaw.yh@gmail.com